 Gwen Awbery writes
I have a longstanding problem trying to get hold of a blank, basic vowel chart which would be compatible with OpenOffice or similar, and to which I could add vowel symbols as required. Is there such a resource lurking out there somewhere in cyberspace? It seems likely, but I haven't been able to locate one. I would be very grateful for any advice on this.
I did a Google search for “blank vowel chart”, which threw up this file from Wikimedia commons.
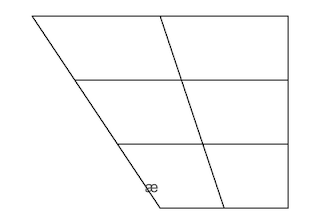
Once you’ve saved a copy of the blank diagram to your own computer, the next question is how to add vowel symbols to it. Presumably you need to use some kind of graphics program. I succeeded in adding the symbol æ, using the Photostudio software that came bundled with my printer (which is what I use for scanning, cropping and resizing the assorted illustrations that accompany my blog). See above.
However, many graphics programs, including this one, seem to have trouble with Unicode text. Although I haven’t spent long on this, I have not so far succeeded in superimposing vowel symbols such as ɛ, ɔ, ʊ, ɑ̃.
I haven’t tried the Draw program that comes with OpenOffice.
Can someone with greater experience of graphics software offer Gwen (and the rest of us) some advice?
How do Wikipedians achieve results like the chart of AmE vowels I found here?
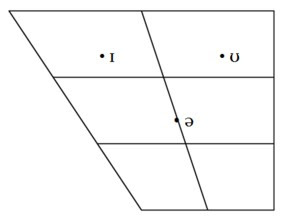
PS: inspired by Gerald Kelly (see comments below), here’s one I have just made in Powerpoint. To convert the result into a jpg I took a screenshot (Alt-PrtScrn) and then cropped and resized it with Photostudio.

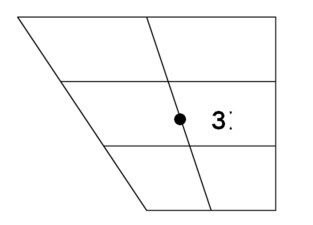
PPS: further inspired, this time by David Crosbie, here’s one made in Word for Windows Vista.

Thanks to all.


Pictures such as these are best drawn in a vector format (as opposed to a raster/bitmap format). The most common is SVG, which can be edited by the free program Inkscape.
ReplyDeleteHere's the blank vowel diagram in a vector version:
http://commons.wikimedia.org/wiki/File:Blank_vowel_trapezoid.svg
Note that SVG files are less supported in browsers than for example PNG (a bitmap format), so if you want to publish the picture, you might want to convert it to a bitmap.
When I was writing "How to Teach Pronunciation" (11 yrs ago!) I did this in MS Word and Powerpoint by trial and error, having scanned a blank (tippexed/snopaked) chart, pasting it in to a powerpoint as a jpeg, adding dots, moving the postion, grouping the image, saving the image, and then pasting it into my Word doc! It took hours for the first few, then I got it down to a fine art. I'm sure there are easier ways...
ReplyDeleteThat vowel chart looks like it was made in LaTeX, using the TIPA package. Wikipedia uses MediaWiki which, according to this help page, allows the use of LaTeX in creating pages.
ReplyDeleteYou can load the SVG that Johannes found into Inkscape, and add Unicode characters there. Inkscape saves as SVG, which works in most browsers, but I've found that Firefox doesn't get the 'Scaleable' bit right, and renders it as a fixed size. For quick and easy web publishing, you can export as PNG from Inkscape.
ReplyDeleteOpenOffice still doesn't support SVG natively, but there is a converter that works reasonably well.
This works with MS Word 2008 on my Mac.
ReplyDelete1. Download the file above and Copy Image
2. In Word, pull down Paste Special from the Edit menu -- or access it from the ribbon.
3. Select picture
4. Format the picture Layout
(I just double-clicked it, but your sustem may be different)
5. Select Appearance
6.From the Wrapping style choices, select Behind text
7. Insert a Text Box
8. Simultaneously adjust the box size and font size (clicking in different places) until you can type and see a single character of a suitable size.
9. If necessary, format the text box:
a. Color and Lines should be set for for No Fill and No Line
b. Layout is OK if Wrapping style is set as Tight (I haven't tried any other)
10. Drag your text box to the desired position on the diagram.
(If necessary, you can still adjust the font size.
And if the character is too big for the box, you can still increase the box size.)
11. Repeat steps 7-10 for each character.
The boxes remain moveable, but you can freeze them in position at any point as follows:
1. Simultaneously Select the diagram picture and the character(s) you wish to freeze.
2. Find the Grouping option.
(In Word 2008, this is done with the Formatting palette accessed from the View menu
There's then a choice Size, Rotation and Ordering)
3. Under Grouping select the option Group
You can at any time repeat this to freeze another character to the diagram. You can also at any time reverse the last addition thus:
1. Select the grouped diagram.
2. Find Grouping as above.
3. Select Ungroup
You can do this as many times as you like.
This will give you a diagram where the letters overlay the lines of the diagram. To avoid this, you will need to use a white Fill in each text box. And you may well have to adjust the size of the boxes.
Postscript
ReplyDeleteI neglected the dots.
To get a suitable dot, format each box as a bulleted list. Then Format Bullets and Numbering. The text box will need to be wider.
I have used David Crosbie's method for years, but without the Grouping option, which I now look forward to trying. Thanks for the tip, David!
ReplyDeleteChime to the suggestion about Inscape. Just be sure to download ths file as a SVG and not as a PNG. If you download one that already has many of the symbols you want, you can simply move them around. Some of the other images relevant to the anatomy of the vocal tract are also SVGs, Inkscape is pretty useful if you want to customize/edit them.
ReplyDeleteTo anyone who might like the look of the half-dozen diagrams at Section 3.1 ¶46 at www.yek.me.uk I may say that they were executed by my collaborator who may be contacted via webmaster@www.yek.me.uk.
ReplyDeleteLaTeX all the way. once you make the template, it's so easy to go back and modify it. plus it's much more attractive.
ReplyDeletein the preamble, \usepackage{vowel}. then inside the document,
\begin{vowel}
\putcvowel{i}{1}
\putcvowel{e}{2}
\putcvowel{a}{15}
\putcvowel{u}{8}
\putcvowel{o}{7}
\end{vowel}
where the first argument of \putcvowel is the vowel and the second is the cardinal-vowel number.
The general procedure suggested by David Crosbie is what I would use in Word or OpenOffice Writer, with the exception of starting with a vector background image for much, much smoother results.
ReplyDeleteBut I don't know if a free vector image is available on the web that would be compatible with Word or Writer -- you would need e.g. emf or wmf on Windows. You can convert the svg above to emf or wmf using Inkscape. I'm pretty sure there must be online services that allow you to convert svg to other formats.
With newer versions of Word, you can also use eps vector images. (Well, you can use eps images even in Word 2000 but I don't think they will display so that you can edit them within Word. But they will print OK to a postscript printer or pdf.)
In addition to converting from svg to other formats, Inkscape is of course the way to go for more complex stuff. But for "normal" users it will be overkill if the only thing they want is a vowel chart.
In particular, Inkscape has four big advantages: (1) It's free an quite powerful; (2) It's available for all major platforms; (3) It handles Unicode without too many problems; and last but definitely not least (4) It can import and then edit pages from pdfs. This last feature has saved my editing life many, many times. So if you can find a nice vector-based image of something in pdf, you can move on from there with great results.
Two more things:
ReplyDelete(1) If you want to import more complex shapes into Word or Writer, try to avoid emf or wmf. Neither of the two formats handles curves well. So the vowel chart, consisting of lines only, will be fine. Anything curvy won't look too great at large zoom settings. Better than most raster images, but not smooth.
(2) For dots, I would prefer dots drawn separately using the Insert Shape command. (I forget what it was called in Word 2003.) This allows you to control them separately -- you can have the symbols not only to the right of the dots, but above, below, etc. To make sure they are the same size, draw one and then copy and paste that one. To resize, select all the dots and resize together.
wjarek
ReplyDeleteYes, I see the advantage of separate dots.
The Insert Shape command has disappeared -- at least in Word 2008 and presumably Word 2007. You now have to reach the Object Palette. I can do this via the drop-down View menu; I presume that Vista users do it though a View ribbon.
As you know, but others may not, the trick is to select Oval, draw one with the same height and width -- i.e. a circle -- and substitute a black Fill.
There is an alternative: to stick with Text Box and use the Insert Symbol command with a Dingbats font or similar.
I had this very problem a while ago, so I wrote a piece of software to solve it. You write a script like this, and it puts out a bitmap:
ReplyDeleteSize=3
1 1 U 'i'
1 3 R 'u'
2 1 U 'e'
2 1 R 'o'
3.5 2 U '6'
This one prints the four Cardinals a e o u and upside-down 'a' in their proper positions. The numbers on each line say where you want the vowel positioned. The first number is the vertical position (1=close, 4-open) and the second is the horizontal position (1=front, 3=back). Fractions are allowed, so 3.5 vertical is halfway between open-mid and open. U/R is un/rounded, and positions the symbol to the left or right of its blob accordingly. The symbols in this case are Sampa, but there's an option to express them numerically and so use any font (as you do in html, for example). 'Size' is an arbitrary number for how big you want the bitmap to be.
The software is currently embedded in a formatter I use to produce the materials on my 'rational language learning' website, but I'll disentangle it and post the link here in a few days.
The circle vowel are used to produced for an acceptable pronunciation, more respected by the native speakers, even if not necessary for comprehension.
ReplyDeleteSomeone should design some sort of online tool so that you could just type in the vowel and position it on the diagram. That would be so easy.
ReplyDeleteI use creately online diagramming software to create these types of diagrams. However I've never created a vowel diagram. This is interesting.
ReplyDelete